Organizations collect enormous amounts of risk information.
Workers’ compensation claims. Liability incidents. Vehicle accidents. Property losses. Inspection findings. Corrective actions. Safety observations. Claim costs. Litigation. Return-to-work activity.
The information is there.
But having more data does not necessarily mean having a better understanding of risk.
The real value comes from connecting the information.
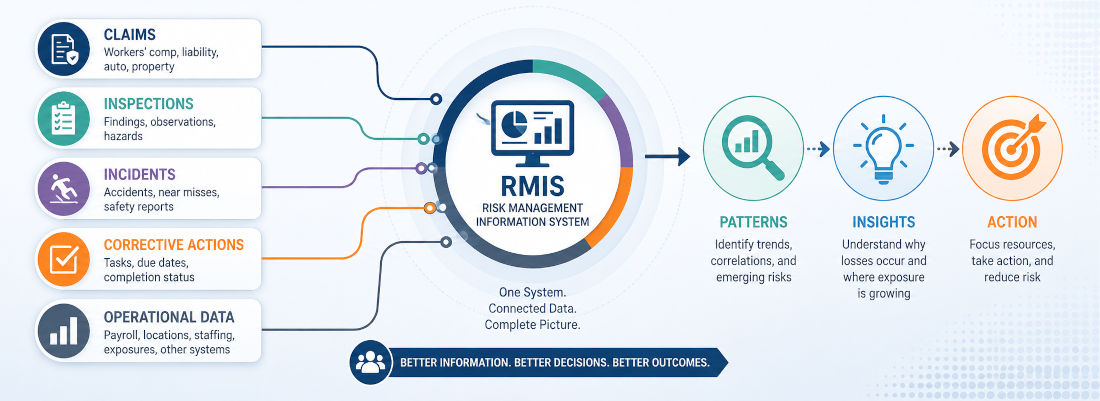
When claims, inspections, incidents, corrective actions, and operational data can be viewed together, organizations can begin to see relationships that are difficult—or impossible—to identify when each function operates independently.
That changes the conversation from:
What happened?
to:
Why did it happen, what else is connected to it, and what should we do next?
A Dashboard Should Support Decisions, Not Just Display Numbers
Risk management dashboards are often designed to make large amounts of information easier to understand.
That is important.
But a dashboard filled with charts and numbers does not automatically provide useful insight.
Imagine a dashboard showing that workers’ compensation costs increased 12% over the previous year.
The number tells you something changed.
It does not tell you why.
A risk professional may need to know:
- Which departments experienced the increase?
- Was the increase caused by more claims or more severe claims?
- Are certain locations driving the change?
- Are particular injury types becoming more common?
- Are reporting delays increasing?
- Are related hazards appearing in inspection records?
- Are corrective actions being completed?
- Are certain claims developing differently from previous cases?
The number is the starting point.
The value comes from being able to investigate what is behind it.
A useful Risk Management Information System (RMIS) should allow users to move from the organizational picture into the underlying information that explains it.
That might mean moving from an overall claims trend to a department, location, incident, inspection finding, or corrective action.
The goal isn’t simply to display more information.
It is to make the information easier to understand and act upon.
Risk Information Becomes More Valuable When It Has Context
Consider a facility that has experienced an increase in liability claims.
Viewed through a claims system alone, the organization can see the number of claims, their costs, locations, causes, and outcomes.
That is useful.
But what if inspection records show that the same facility has also experienced a recurring housekeeping deficiency?
What if several corrective actions related to that deficiency remain overdue?
What if similar findings have appeared at two other facilities?
Now the organization has a very different picture.
The claims data shows where losses are occurring.
The inspection data may help explain why.
The corrective-action data shows whether the organization responded.
And the information from other locations may reveal whether the problem is isolated—or part of a broader pattern.
This is the difference between looking at individual records and looking at connected risk information.
Claims Tell You What Happened
Claims data provides an important historical record.
It can help risk professionals understand:
- Claim frequency and severity
- Payments, reserves, and incurred costs
- Causes of loss and injury types
- Departments and locations
- Lost and restricted workdays
- Return-to-work activity
- Litigation
- Claim duration
- Reporting lag
- Repeat incidents
- Recoveries and subrogation
Individually, each claim tells a story.
Collectively, claims can reveal patterns.
A location with a high number of claims may have a different risk profile than a location with only a few claims but significantly higher severity.
A department with increasing reporting delays may warrant a different type of investigation than one with timely reporting.
A recurring injury type may point toward a common exposure that deserves further attention.
But claims data alone may not explain what is creating the exposure.
That is where other sources of risk information become important.
Inspections Can Help Explain Why Losses Occur
An inspection can provide information that a claim record cannot.
Consider a slip-and-fall claim at a public facility.
The claim may document:
- Where the incident occurred
- What happened
- The injury
- Medical expenses
- Lost workdays
- Litigation activity
- The eventual claim outcome
But an inspection record may reveal additional information.
Was a flooring problem previously identified?
Was poor lighting documented?
Was drainage an issue?
Was the finding assigned to someone for correction?
Was the corrective-action deadline missed?
Had the same condition been identified at another facility?
The claim tells you what happened.
The inspection may help show what was happening before it happened.
That distinction can be critical to proactive risk management.
Your existing article, Everyone Sees the Same Inspection. No One Sees the Same Risk. explores this idea from another perspective: different departments can look at the same inspection finding and see very different implications.
Connected data takes that concept one step further.
It allows those different perspectives to be connected to the broader organizational picture.
Corrective Actions Complete the Story
Identifying a hazard is only the beginning.
The next question is whether the organization did something about it.
Corrective-action information can provide another important piece of the risk picture:
- What action was assigned?
- Who was responsible?
- When was it due?
- Was it completed?
- How long did it remain open?
- Was the correction verified?
- Has the same finding appeared again?
This matters because an inspection finding that is corrected promptly represents a different risk than one that remains unresolved for months.
Your existing Risk-Based Inspection Management content makes this distinction clearly: completing an inspection does not itself reduce risk; addressing the hazards identified during the inspection is what matters.
When corrective-action data is connected to claims and incidents, organizations can also begin asking whether corrective actions are producing the intended results.
For example:
Did incidents involving a particular hazard decline after the corrective action was completed?
Did similar findings continue to appear?
Did another facility experience the same problem?
Was the original corrective action sufficient?
These are questions that become possible when information is connected.
What Happens When Risk Data Is Connected?
The value of connected risk information isn’t simply that everything exists in one place.
It is the relationships between the information.
A connected RMIS can help organizations ask questions such as:
- Which locations have both increasing claims and overdue corrective actions?
- Are departments with longer reporting delays experiencing higher claim costs?
- Were hazards identified before related incidents occurred?
- Are repeat inspection findings associated with repeat claims?
- Did claim frequency change after corrective actions were completed?
- Which facilities are experiencing similar patterns?
- Are certain injury causes appearing alongside recurring inspection findings?
- Where should additional inspections or management attention be directed?
These questions move risk management beyond historical reporting.
Instead of looking at each record independently, risk professionals can examine how different pieces of information relate to one another.
That is where data begins to become risk intelligence.
From Departmental Data to Organizational Risk Intelligence
Risk rarely stays inside one department.
A workplace injury may involve Safety, Human Resources, Risk Management, Finance, and Legal.
A property issue may begin as an inspection finding, become a maintenance request, and eventually become a claim.
A recurring hazard may appear in inspection reports long before its financial impact becomes visible in claims data.
Each department may have valuable information.
The challenge is connecting it.
This is also the broader issue explored in Recordables’ article What Would Be the Impact if Finance, Legal, and Safety Reported to Risk Management? That article examines how departmental silos can prevent organizations from seeing the full picture of risk.
Connected technology does not eliminate the need for departments to have their own responsibilities or expertise.
It gives those departments a common source of information from which to make decisions.
Safety can see the hazards.
Operations can see the corrective actions.
Claims can see the losses.
Finance can see the costs.
Leadership can see the organizational impact.
Risk Management can connect the dots.
Better Questions Lead to Better Risk Management
The purpose of connecting data isn’t to give risk professionals more reports to review.
It is to help them ask better questions.
Instead of asking:
How many inspections did we complete?
They can ask:
Which inspection findings are associated with our greatest exposure?
Instead of:
How many claims did we have?
They can ask:
Where are claims increasing, and what other risk information exists at those locations?
Instead of:
How many corrective actions were completed?
They can ask:
Did completing those corrective actions change the pattern of incidents or claims?
Instead of:
What happened last year?
They can ask:
What patterns are developing now?
That shift—from counting activity to understanding relationships—is one of the most important opportunities created by connected risk management data.
Where Analytics Adds Another Layer
Once risk information is connected, analytics can help organizations identify trends that might otherwise remain buried in individual records.
Dashboards can show developing patterns.
Drilldown reporting can help users investigate those patterns.
Trend analysis can reveal changes over time.
And predictive analytics can examine relationships across larger volumes of information to identify potential areas of concern.
But analytics should not be confused with certainty.
A pattern does not guarantee an outcome.
A correlation does not automatically establish a cause.
And a recommendation should not replace professional judgment.
The purpose of analytics is to help risk professionals see more of the information that may be relevant to a decision.
Artificial intelligence can add another layer by helping identify patterns, anomalies, and relationships across large datasets. Recordables explores that role more fully in AI Doesn’t Reduce Risk. Better Decisions Do.
The important distinction is that AI is most useful when it supports the people responsible for evaluating and acting on risk.
Data Quality Still Matters
Connected data is only useful when the underlying information is reliable.
Inconsistent classifications can make trends difficult to interpret.
Delayed reporting can distort timelines.
Incomplete inspection findings can hide important details.
Missing corrective-action information can make it difficult to determine whether a hazard was actually resolved.
Organizations therefore need more than technology.
They need consistent processes for collecting, classifying, updating, and reviewing risk information.
The better the information going into the system, the more useful the information coming out can be.
From Historical Reporting to Proactive Risk Management
Traditional risk reporting primarily tells organizations what has already happened.
Connected risk management data can help explain how different events, hazards, actions, and outcomes relate to one another.
That creates the opportunity to move from:
Reporting what happened
to
Understanding why it happened
to
Identifying where similar problems may develop
to
Taking action before another loss occurs
This is where a Risk Management Information System can become more than a repository for claims and reports.
It can become a source of organizational risk intelligence.
The Value of Connecting the Pieces
Recordables brings together multiple areas of risk management through its integrated software solutions.
TrackComp® helps organizations manage workers’ compensation, safety, return-to-work, and occupational health information.
TrackAbility® manages liability claims, litigation, payments, reserves, and recoveries.
TrackVerify® supports inspections, hazard identification, follow-up, and corrective actions.
TrackAlytics® provides dashboards, drilldown reporting, trend analysis, predictive insights, and recommendations.
When organizations view this information as part of a connected risk management strategy, they gain more than individual reports.
They gain context.
A claim can be viewed alongside an inspection.
An inspection can be viewed alongside a corrective action.
A corrective action can be evaluated alongside subsequent incidents.
And organizational trends can be viewed alongside the financial impact of those events.
That broader perspective can help risk professionals identify developing problems earlier, focus attention where it is needed, and make more informed decisions.
Because the goal of connected data isn’t simply to have more information.
It is to understand what the information is telling you—and act on it.
Want to see how Recordables can benefit your organization? Schedule a demo →

Paul Kofman, President of Recordables, has been providing software solutions in Risk Management, Claims Management, Disability Management, Safety, and Occupational for more than 30 years.